
Page 14 - Steel Tech India eMagazine Volume January 2023
P. 14
92/ Ć ,668( Ć 2FWREHU
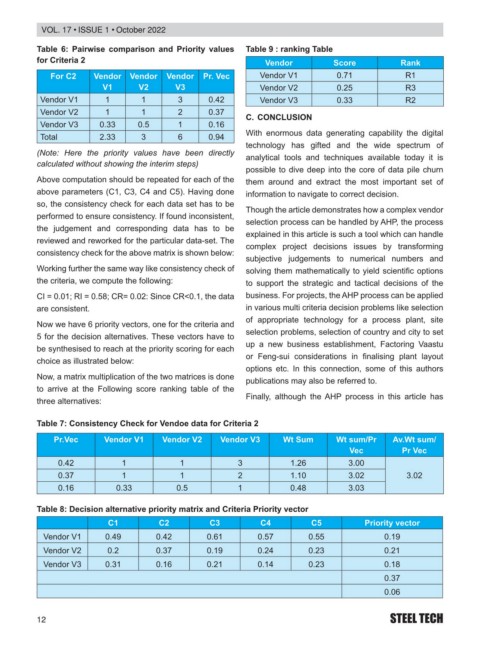
Table 6: Pairwise comparison and Priority values Table 9 : ranking Table
for Criteria 2 Vendor Score Rank
For C2 Vendor Vendor Vendor Pr. Vec Vendor V1 0.71 R1
V1 V2 V3 Vendor V2 0.25 R3
Vendor V1 1 1 3 0.42 Vendor V3 0.33 R2
Vendor V2 1 1 2 0.37
C. CONCLUSION
Vendor V3 0.33 0.5 1 0.16
With enormous data generating capability the digital
Total 2.33 3 6 0.94
technology has gifted and the wide spectrum of
(Note: Here the priority values have been directly analytical tools and techniques available today it is
calculated without showing the interim steps)
possible to dive deep into the core of data pile churn
Above computation should be repeated for each of the them around and extract the most important set of
above parameters (C1, C3, C4 and C5). Having done information to navigate to correct decision.
so, the consistency check for each data set has to be
Though the article demonstrates how a complex vendor
performed to ensure consistency. If found inconsistent,
selection process can be handled by AHP, the process
the judgement and corresponding data has to be
explained in this article is such a tool which can handle
reviewed and reworked for the particular data-set. The
complex project decisions issues by transforming
consistency check for the above matrix is shown below:
subjective judgements to numerical numbers and
Working further the same way like consistency check of VROYLQJ WKHP PDWKHPDWLFDOO\ WR \LHOG VFLHQWL¿F RSWLRQV
the criteria, we compute the following: to support the strategic and tactical decisions of the
CI = 0.01; RI = 0.58; CR= 0.02: Since CR<0.1, the data business. For projects, the AHP process can be applied
are consistent. in various multi criteria decision problems like selection
of appropriate technology for a process plant, site
Now we have 6 priority vectors, one for the criteria and
selection problems, selection of country and city to set
5 for the decision alternatives. These vectors have to
up a new business establishment, Factoring Vaastu
be synthesised to reach at the priority scoring for each
RU )HQJ VXL FRQVLGHUDWLRQV LQ ¿QDOLVLQJ SODQW OD\RXW
choice as illustrated below:
options etc. In this connection, some of this authors
Now, a matrix multiplication of the two matrices is done
publications may also be referred to.
to arrive at the Following score ranking table of the
Finally, although the AHP process in this article has
three alternatives:
Table 7: Consistency Check for Vendoe data for Criteria 2
Pr.Vec Vendor V1 Vendor V2 Vendor V3 Wt Sum Wt sum/Pr Av.Wt sum/
Vec Pr Vec
0.42 1 1 3 1.26 3.00
0.37 1 1 2 1.10 3.02 3.02
0.16 0.33 0.5 1 0.48 3.03
Table 8: Decision alternative priority matrix and Criteria Priority vector
C1 C2 C3 C4 C5 Priority vector
Vendor V1 0.49 0.42 0.61 0.57 0.55 0.19
Vendor V2 0.2 0.37 0.19 0.24 0.23 0.21
Vendor V3 0.31 0.16 0.21 0.14 0.23 0.18
0.37
0.06
STEEL TECH