
Page 13 - Steel Tech India eMagazine Volume January 2023
P. 13
92/ Ć ,668( Ć 2FWREHU
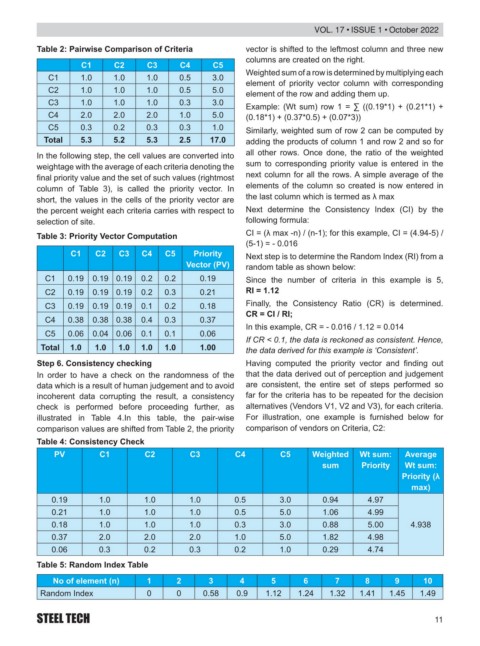
Table 2: Pairwise Comparison of Criteria vector is shifted to the leftmost column and three new
columns are created on the right.
C1 C2 C3 C4 C5
Weighted sum of a row is determined by multiplying each
C1 1.0 1.0 1.0 0.5 3.0
element of priority vector column with corresponding
C2 1.0 1.0 1.0 0.5 5.0
element of the row and adding them up.
C3 1.0 1.0 1.0 0.3 3.0
([DPSOH :W VXP URZ
C4 2.0 2.0 2.0 1.0 5.0
C5 0.3 0.2 0.3 0.3 1.0 Similarly, weighted sum of row 2 can be computed by
Total 5.3 5.2 5.3 2.5 17.0 adding the products of column 1 and row 2 and so for
In the following step, the cell values are converted into all other rows. Once done, the ratio of the weighted
weightage with the average of each criteria denoting the sum to corresponding priority value is entered in the
¿QDO SULRULW\ YDOXH DQG WKH VHW RI VXFK YDOXHV ULJKWPRVW next column for all the rows. A simple average of the
column of Table 3), is called the priority vector. In elements of the column so created is now entered in
short, the values in the cells of the priority vector are WKH ODVW FROXPQ ZKLFK LV WHUPHG DV Ȝ PD[
the percent weight each criteria carries with respect to Next determine the Consistency Index (CI) by the
selection of site. following formula:
Table 3: Priority Vector Computation &, Ȝ PD[ Q Q IRU WKLV H[DPSOH &,
(5-1) = - 0.016
C1 C2 C3 C4 C5 Priority Next step is to determine the Random Index (RI) from a
Vector (PV) random table as shown below:
C1 0.19 0.19 0.19 0.2 0.2 0.19 Since the number of criteria in this example is 5,
C2 0.19 0.19 0.19 0.2 0.3 0.21 RI = 1.12
C3 0.19 0.19 0.19 0.1 0.2 0.18 Finally, the Consistency Ratio (CR) is determined.
CR = CI / RI;
C4 0.38 0.38 0.38 0.4 0.3 0.37
,Q WKLV H[DPSOH &5
C5 0.06 0.04 0.06 0.1 0.1 0.06
If CR < 0.1, the data is reckoned as consistent. Hence,
Total 1.0 1.0 1.0 1.0 1.0 1.00 the data derived for this example is ‘Consistent’.
Step 6. Consistency checking +DYLQJ FRPSXWHG WKH SULRULW\ YHFWRU DQG ¿QGLQJ RXW
In order to have a check on the randomness of the that the data derived out of perception and judgement
data which is a result of human judgement and to avoid are consistent, the entire set of steps performed so
incoherent data corrupting the result, a consistency far for the criteria has to be repeated for the decision
check is performed before proceeding further, as alternatives (Vendors V1, V2 and V3), for each criteria.
illustrated in Table 4.In this table, the pair-wise For illustration, one example is furnished below for
comparison values are shifted from Table 2, the priority comparison of vendors on Criteria, C2:
Table 4: Consistency Check
PV C1 C2 C3 C4 C5 Weighted Wt sum: Average
sum Priority Wt sum:
3ULRULW\ Ȝ
max)
0.19 1.0 1.0 1.0 0.5 3.0 0.94 4.97
0.21 1.0 1.0 1.0 0.5 5.0 1.06 4.99
0.18 1.0 1.0 1.0 0.3 3.0 0.88 5.00 4.938
0.37 2.0 2.0 2.0 1.0 5.0 1.82 4.98
0.06 0.3 0.2 0.3 0.2 1.0 0.29 4.74
Table 5: Random Index Table
No of element (n) 1 2 3 4 5 6 7 8 9 10
Random Index 0 0 0.58 0.9 1.12 1.24 1.32 1.41 1.45 1.49
STEEL TECH